Two Yonge Street
plays in Thornhill.
An acquisition at 7471 Yonge Street and a 1.78-acre development assembly at 7509–7529 Yonge Street, both a five-minute walk from the future Clark Station on the Yonge North Subway Extension. The Graziani + Corazza proposal for the assembly is twin 60-storey towers over an 8-storey podium: 1,330 residential homes and on the order of ~1.07M sf of buildable space on land that a subway line is about to reprice. What makes it extraordinary is what the program is for. The entire residential build is directed at rent-stabilized housing for hospitality workers, funded through the philanthropic share of the Prima network, on the most valuable transit corridor in the region.
- 1.78 ac
- Assembly site area
- ~1.07M sf
- Buildable area
- 1,330
- Residential units
- 173,760 sf
- Podium GFA
Zee Holdings Inc.
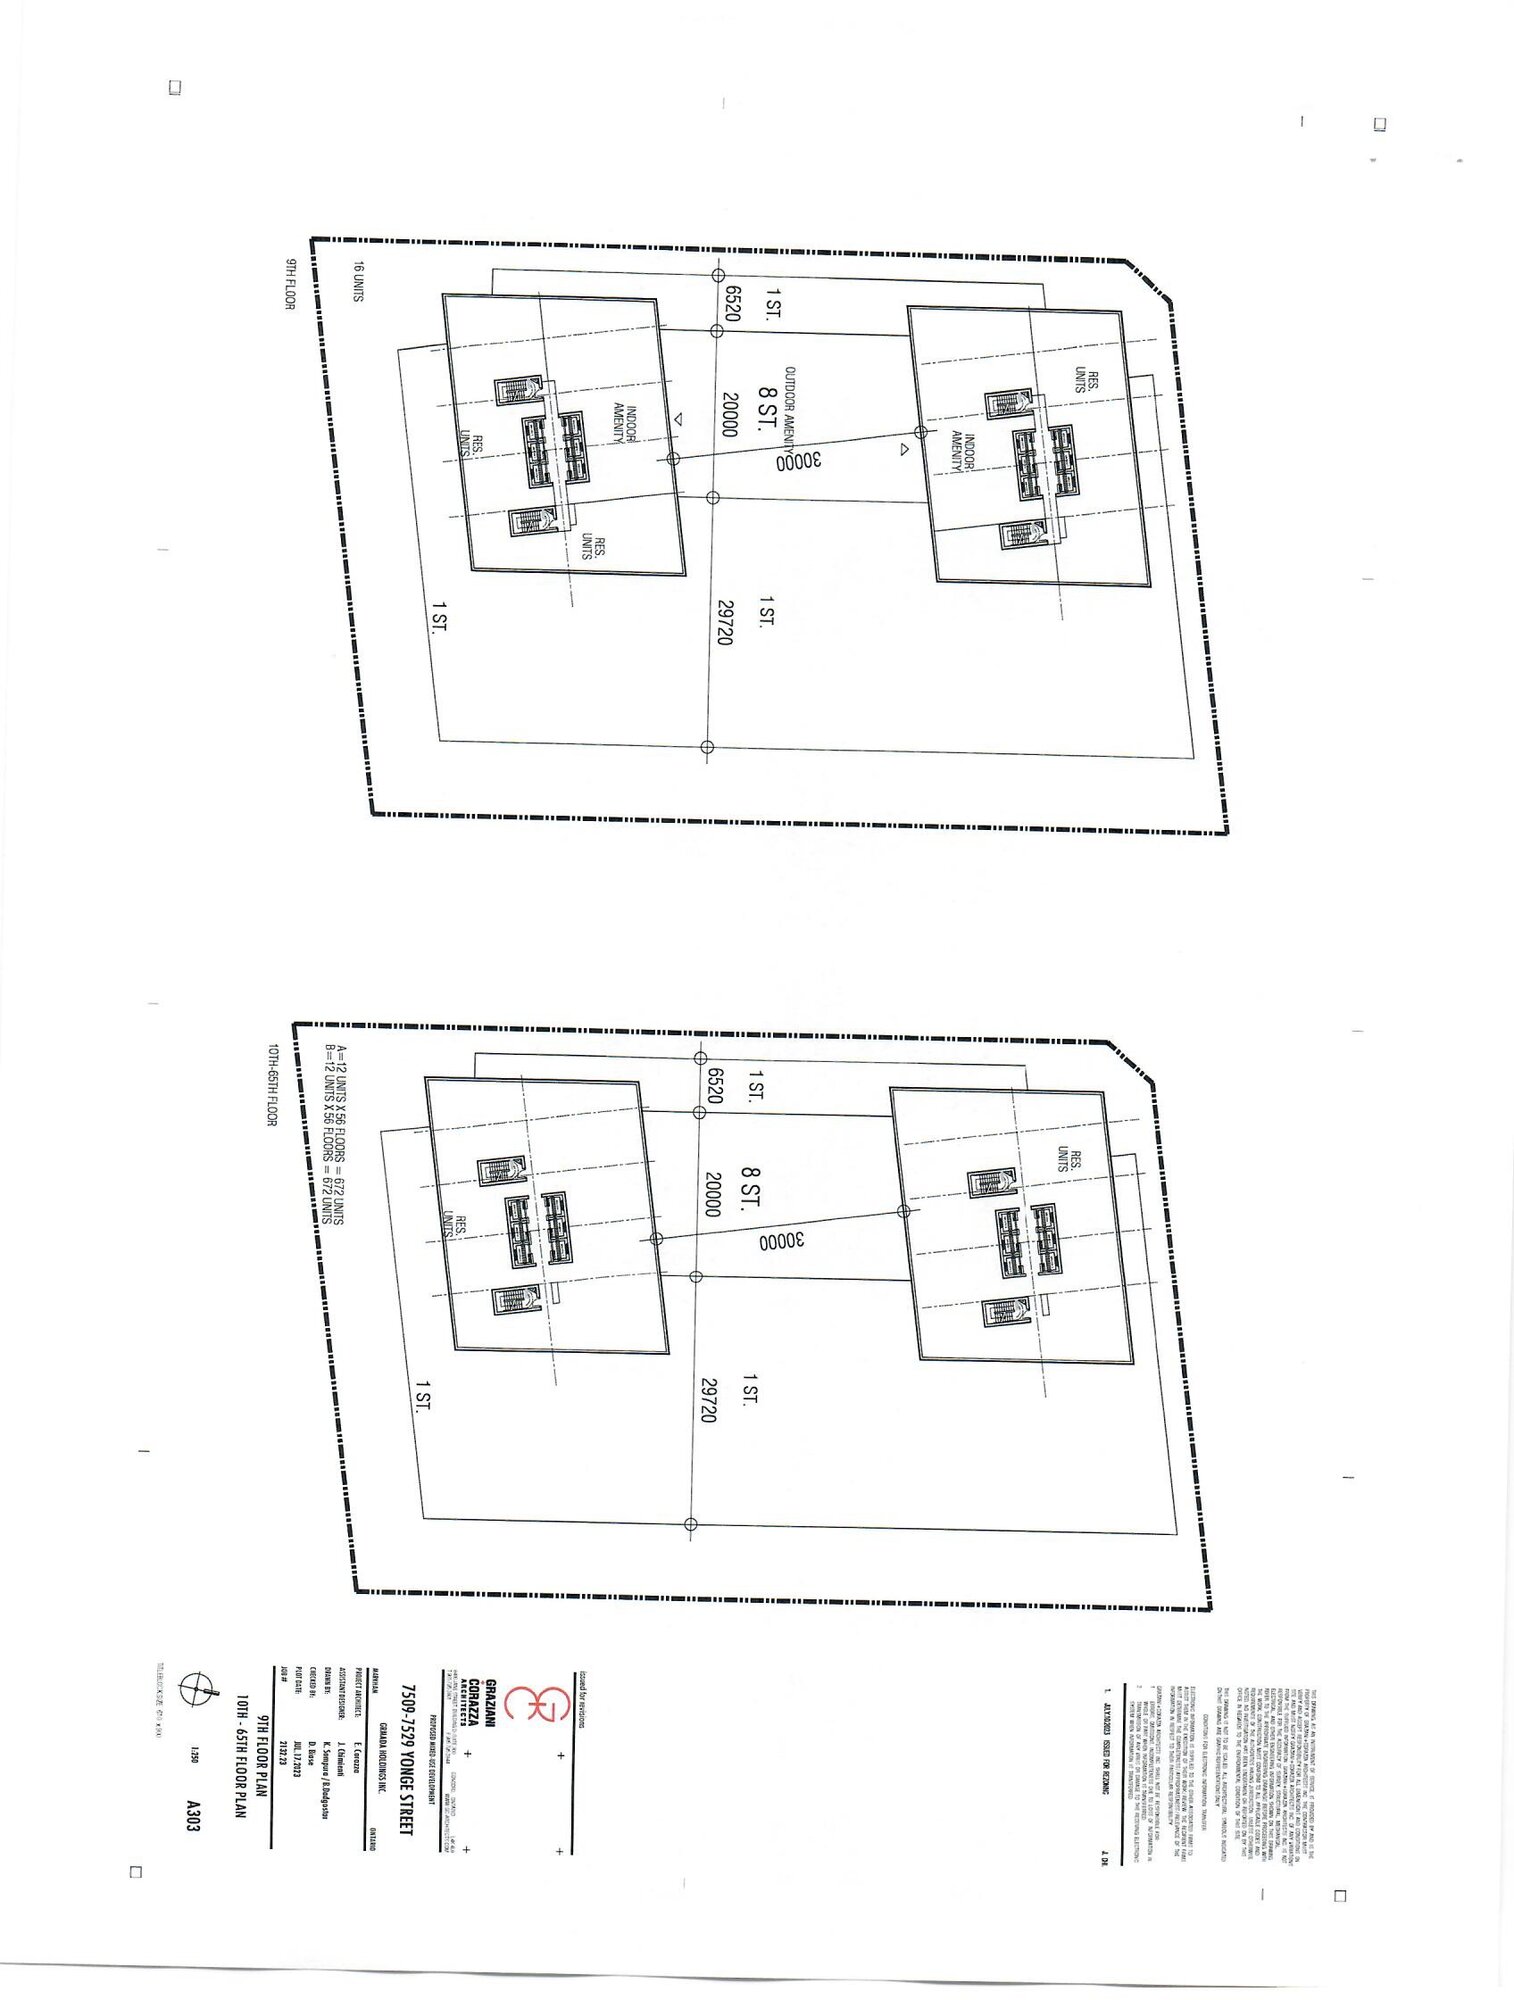
Buildable area is derived from the architect’s figures already in this deck: 16,142 sqm of podium GFA plus 52 tower floors per tower at approximately 800 sqm. It is an approximation, not a stated gross floor area.
Market Analysis
Thornhill sits at the point where Toronto's rental pressure meets York Region's transit build-out. The Yonge corridor between Steeles and Highway 7 is being rezoned for height at exactly the moment the Yonge North Subway Extension puts a Line 1 station within a five-minute walk of both subject sites.
The demand case is not a luxury-condo case. It is a labour-supply case. The hospitality economy that the corridor's restaurants, hotels and retail depend on cannot afford to live near where it works, and the gap between a food-service wage and an average Markham rent is the single clearest number in this section.
Every figure below is footnoted to a published source. Where a defensible current figure could not be found, the gap is stated rather than filled with an estimate.
Thornhill is not a generic suburban node. It holds the largest Jewish population share of any federal riding in Canada, an educated and settled household base, and a rental stock too thin to absorb anyone new.
Roughly one in three residents of the Thornhill riding is Jewish, the largest share of any federal riding in the country1. The corridor is not a blank site being marketed to a hypothetical renter. It is the centre of an established community with its own schools, synagogues, grocery, kosher food service and restaurants already on Yonge and Bathurst.
That matters to a hospitality workforce building. The venues that employ the workers, and the venues the workers serve, are already here.
Population in private households reporting a religious affiliation in the 2021 Census. Categories below 1.8% are not shown.
The underlying figures (5)
The catchment is wealthy by every published measure, which is exactly why the people who staff its restaurants and hotels cannot live in it.
Markham households clear the provincial median by roughly $12,500 and the national median by $19,0003. All three figures are after tax, so they compare directly.
Second highest in the GTHA, up 7.7% since 2016. 34% of private households in the Region are above $150,000.
20% above the Ontario average and 9% above York Region. This is the spending base the corridor's restaurants and hotels serve, and the reason they cannot staff themselves locally.
The underlying figures (4)
Four nodes on the same subway line, read against the things that decide whether a workforce building works.
| Comparison | Yonge and Clark The subject corridor | North York Centre Yonge south of Steeles | Richmond Hill Centre Yonge and Highway 7 | Vaughan Metropolitan Centre Highway 7 and Jane |
|---|---|---|---|---|
| New Line 1 station | Clark Station, under construction, five-minute walk | Served since 1987 | Terminus station, same extension | Served since 2017, Line 1 west leg |
| Catchment income | York Region median $112,000; Vaughan 20% above Ontario | Toronto average, below York Region median | Comparable York Region income | Vaughan household income, strong |
| Existing hospitality density | Yonge and Bathurst restaurant and kosher food-service cluster | Dense and mature | Auto-oriented, limited street retail | New-build, still forming |
| Rental stock to compete with | Thin: 21.6% of households rent | Deep: decades of tower stock already leased | Growing quickly | Deep and rising: large delivered pipeline |
| Community anchor | Established Jewish community, largest share of any riding | Diffuse | Diffuse | New district, no established community |
| Land basis | Low-rise Yonge frontage, assembled | Priced on existing transit | Largely land-banked by institutional owners | Priced on delivered transit |
Sponsor commentary, not a published ranking. The income, tenure and community figures are sourced above; the comparative reading of each node is the sponsor's own. The argument is narrow: Yonge and Clark is the only one of the four that pairs a station still under construction with a high-income, low-rental-stock catchment and a hospitality cluster already trading.
Five published rent points, drawn to scale against the proposed worker rent. Rents have softened for a year and are still a multiple of what a hospitality wage carries.
The underlying figures (5)
The national vacancy rate is rising on record purpose-built completions. That is not the market the corridor sits in. Rental condominium apartments in the GTA sit at 1% vacancy, and the scarcity is priced.
At 1% there is effectively no slack in the condominium rental pool that houses most corridor workers.
A renter who declines a price has nowhere else to go inside the same commute.
Scarcity turns a listing into an auction, and the clearing price is set by the strongest bidder, not the median one.
GTA condominium 2-bedroom rent runs 43% above purpose-built rent, in the segment with a third of the vacancy.
Sponsor reading, not a CMHC finding: the national rate is loosening on record purpose-built completions, but the segment that houses corridor workers sits at 1%. Pricing spikes in that segment are a scarcity artefact rather than a signal of what the housing is worth to the person renting it.
The underlying figures (6)
What that pricing does to the households paying it, in the corridor's own municipalities.
Share of households spending more than 30% of income on shelter, 2021 Census8. The ember line marks half of all households. Every renter group in the corridor's municipalities sits at or near it; Markham owners sit twenty points below.
Cost grew at twice the rate of the income paying it, over five years, in the region the corridor sits in. Renter households in York Region grew 38% over the same window: more renters, competing for the same stock, at prices rising faster than pay.
The underlying figures (4)
The workforce on the other side of the gap, and the scale the corridor addresses.
5.2% of Ontario's workforce and 36.9% of the national sector. This is the population the corridor draws from.
Chronic understaffing at a scale that no wage increase alone has closed.
The sector shrank in 2024 while demand recovered: a retention constraint, not a demand problem.
The full 1,330-unit program at two workers per unit. Small against the sector, decisive for the venues inside it.
The underlying figures (5)
Nearly half of York Region renter households already spend more than 30% of income on shelter, and renter housing costs have risen twice as fast as household income since 2016. A sector employing 420,500 people in Ontario, carrying roughly 100,000 unfilled positions nationally, cannot house its own workforce in the corridor it serves. Section 03 sets out how that gap gets closed.
- Absolute count of Jewish residents in Thornhill. The 31.4% share is published; the riding's 2021 population base was not re-verified, so no head count is stated.
- Median or average household income for Thornhill specifically. Published income data is by municipality (Markham, Vaughan) and by region, not by riding.
- CMHC purpose-built vacancy rate and average rent for Markham specifically. CMHC publishes the Richmond Hill / Vaughan / King survey zone, but not a Markham-only static figure.
- York Region purpose-built rental stock size and annual completions.
- Median renter household income for York Region or the Toronto CMA.
- Median or average hourly wage for food and beverage and accommodation workers. The Tourism HR Canada compensation study is a paid report.
- Annual staff turnover rate in foodservice. Held in Restaurants Canada's paywalled Foodservice Facts 2025.
- Current ridership projections for the Yonge North Subway Extension. Only a 2021 business case figure exists and it has not been re-verified.
- 12021 Census of Population, Thornhill federal riding profile (compiled by 338Canada)
- 2York Region, 2021 Census Release Report — Income
- 3Statistics Canada, Focus on Geography Series, 2021 Census — Income
- 4Vaughan Economic Development, 2021 Census Insights — Income Profiles
- 5Toronto Regional Real Estate Board, Rental Market Report, Q4 2025
- 6Rentals.ca and Urbanation, National Rent Report
- 7CMHC, Rental Market Report and vacancy release, December 2025
- 8York Region, 2021 Census Release Report — Housing
- 9Job Bank / ESDC, Sectoral Profile: Accommodation and Food Services, Ontario
- 10Restaurants Canada, sector commentary and quarterly reporting
- 11Statistics Canada, Job vacancies and payroll employment
- 12Metrolinx, Yonge North Subway Extension project page
- 13York Region, Growth and Development Review
The Workforce Housing Corridor
The proposal is not a workforce tier inside a market building. It is the entire 1,330-unit residential program at 7509–7529 Yonge, built as a single-purpose home for hospitality workers at $500 per month, on land the sponsor builds and operates directly.
The subsidy is not an expense line for the venue. A participating venue pays nothing beyond the fee it already pays Prima on a delivered recommendation. Half of that fee goes to the recommender and leaves the system. Out of Prima's half, a quarter pays demand and supply aggregation and the remaining three quarters is profit against which nothing further is owed. That profit is returned to the local market that generated it.
This corridor is what that philanthropic leg looks like when it stops being a cheque and becomes a building. The market that produces the revenue is the hospitality market, so the money returns to the people who work in it, as housing they can hold on a hospitality wage.
At full scale the gap between worker rent and market rent is $28.9M a year. At the current restaurant fee, one delivered recommendation produces $13.50 of housing money, so roughly 178,614 delivered recommendations a month across Toronto funds the entire building. That is a reachable network milestone rather than a distant one. Until it is reached the sponsor carries the balance as a below-market rent position on an asset it owns, and that bridge shrinks with every month of network growth.
The Prima Network Rail waterfall, followed to its end. One delivered recommendation, traced from the fee that clears to the front door of a home on Yonge.
The current average on a restaurant recommendation. A venue inside the Prima ecosystem pays it on delivery. Nothing extra is invoiced for housing.
Half, paid straight out to the person who made the recommendation. This side leaves the system here.
The only half that continues down the waterfall. Everything below is carved out of this half.
25% of Prima's half, paid to whoever brought the person who books and whoever brought the venue.
75% of Prima's half. There is no further cost against it; the whole amount is available to distribute.
The distributable profit is returned to the market that generated it, rather than warehoused.
The flow is directed into the workforce housing pool. Staff of participating venues are placed at a fixed rent.
The same chain in dollars, at the current restaurant fee.
A venue in the Prima ecosystem takes a delivered recommendation and pays the fee it already pays.
Half goes to the recommender and leaves the system. Half continues.
After 25% to demand and supply aggregation, the remainder carries no further cost and returns to the market that generated it.
Monthly volume that covers one worker's $907 share of the rent gap.
Fixed for 36 months of continuous employment. The venue pays nothing extra.
These are sponsor inputs for illustration, not contracted terms. Only the total unit count, the market rent benchmark and the Prima waterfall come from outside this document.
What a venue's own Prima volume funds, expressed in staff housed. No cash contribution is involved; this is the philanthropic flow the venue's activity generates.
How much of the full 1,330-unit building the Toronto philanthropic flow covers at different network volumes, and what the sponsor carries at each stage as a below-market rent position.
| Network stage | Recommendations / mo | Philanthropic / mo | Units funded | Coverage | Sponsor carries / mo |
|---|---|---|---|---|---|
| Early Toronto network | 20,000 | $270K | 149 | 11% | $2.1M |
| Established | 60,000 | $810K | 447 | 34% | $1.6M |
| At scale | 120,000 | $1.6M | 894 | 67% | $791K |
| Fully funded | 178,615 | $2.4M | 1,330 | 100% | — |
Full coverage of all 1,330 units requires 178,614 delivered recommendations per month across the Toronto network. Until then the building still opens in full: units come online with construction, the network funds a rising share of the rent gap, and the sponsor position shrinks against it as Toronto scales.
Illustrative only. Figures derive from the assumptions listed above and change with the carve-out size, the market rent benchmark and the average fee per delivered recommendation. No units are committed to this program and no participation agreements are in place.
Site Views
Satellite and street-level views of both frontages, served live from Google Maps. These are third-party embeds, not commissioned photography. A site walkthrough film can be dropped into the slot below once shot.
No verified video of 7471 Yonge exists in this package. Supply a walkthrough clip and it renders here in place of this panel.
The Opportunity
The Yonge Project consolidates two adjacent positions on Yonge Street in Thornhill, on the Markham–Vaughan border. Both sites sit within roughly a five-minute walk of the future Clark Station, an underground stop on the Yonge North Subway Extension of TTC Line 1.
7471 Yonge Street is an in-place acquisition: Lampe Towers, an existing multi-residential rental building, contracted from Beaux Properties International Inc.
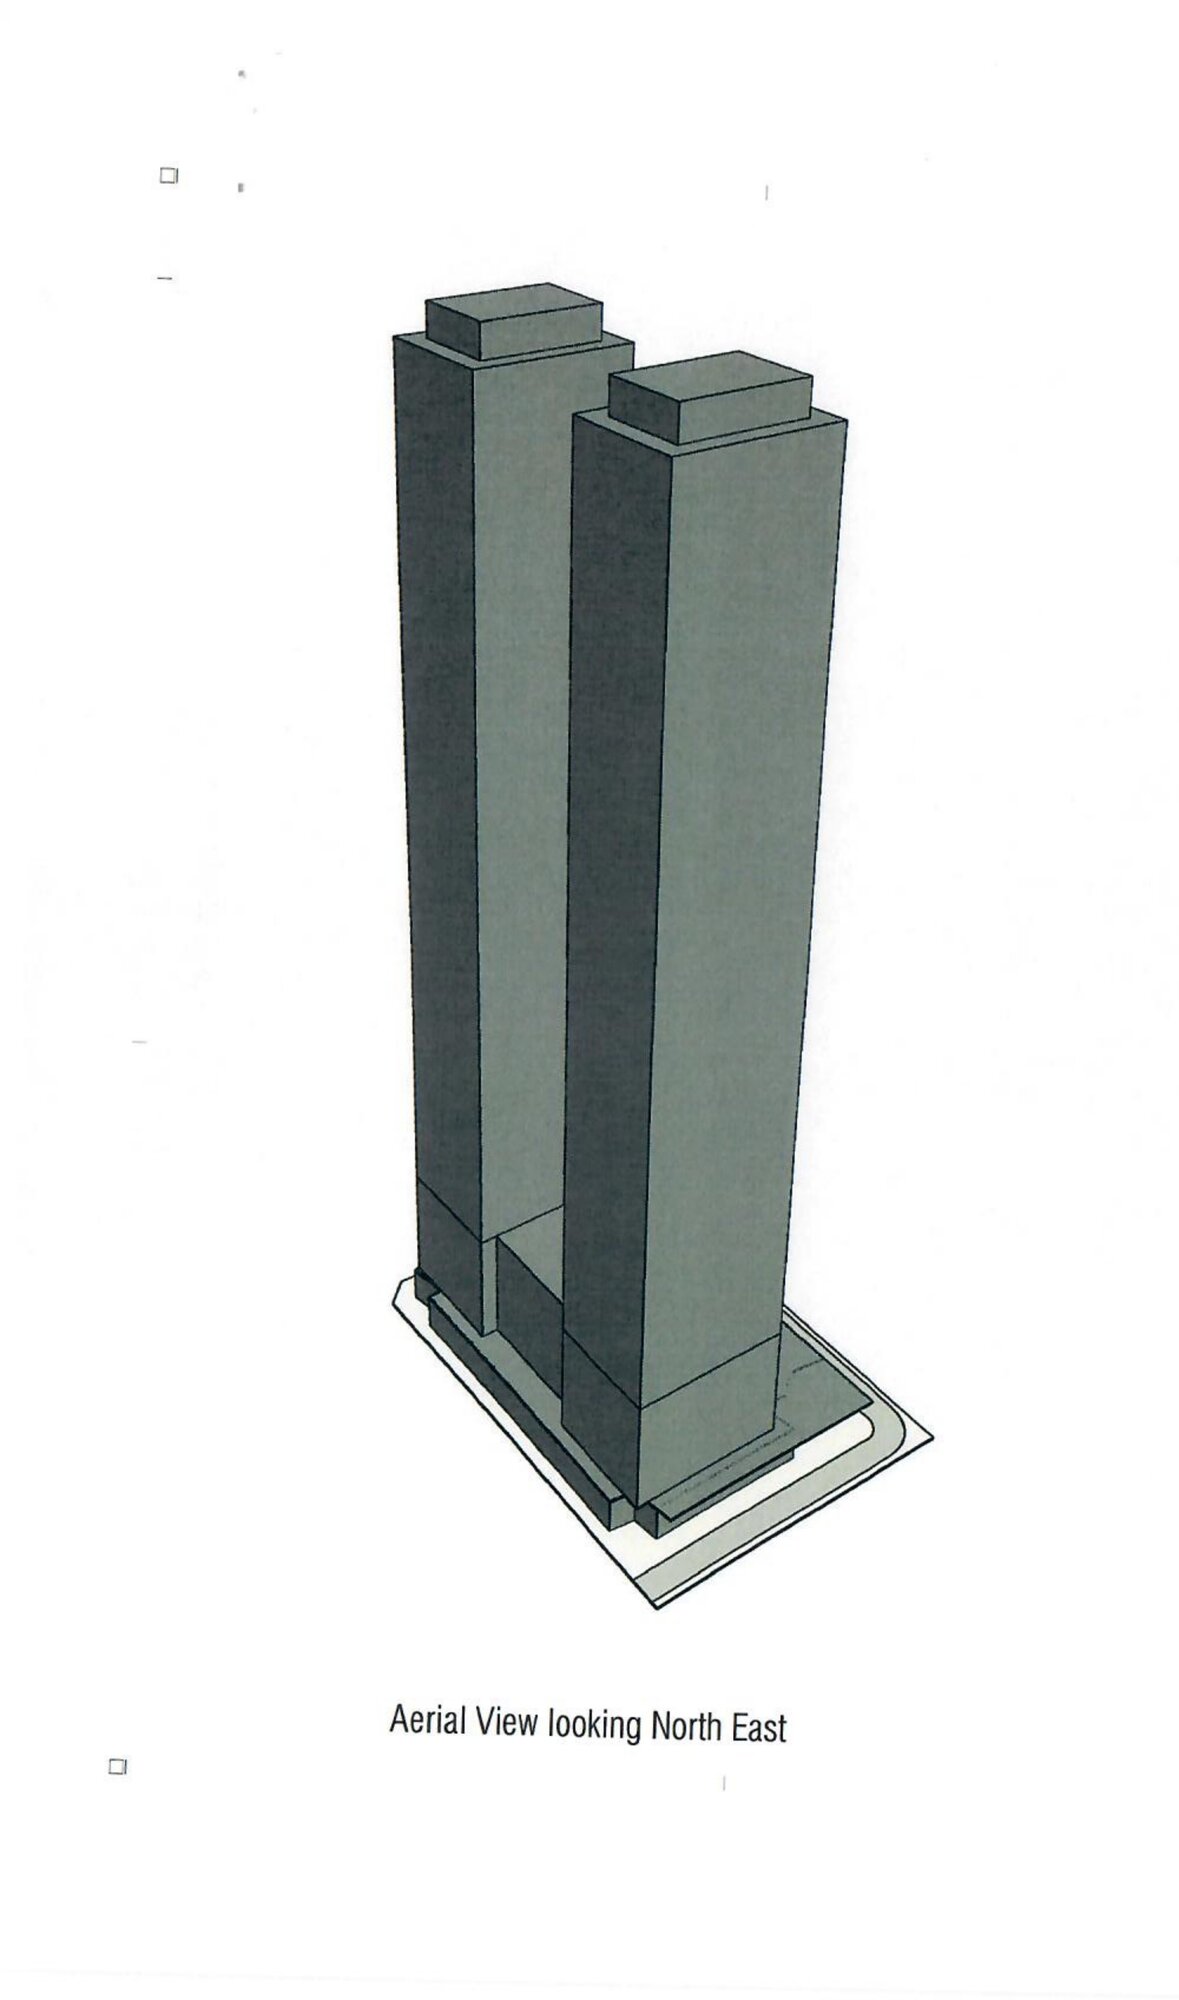
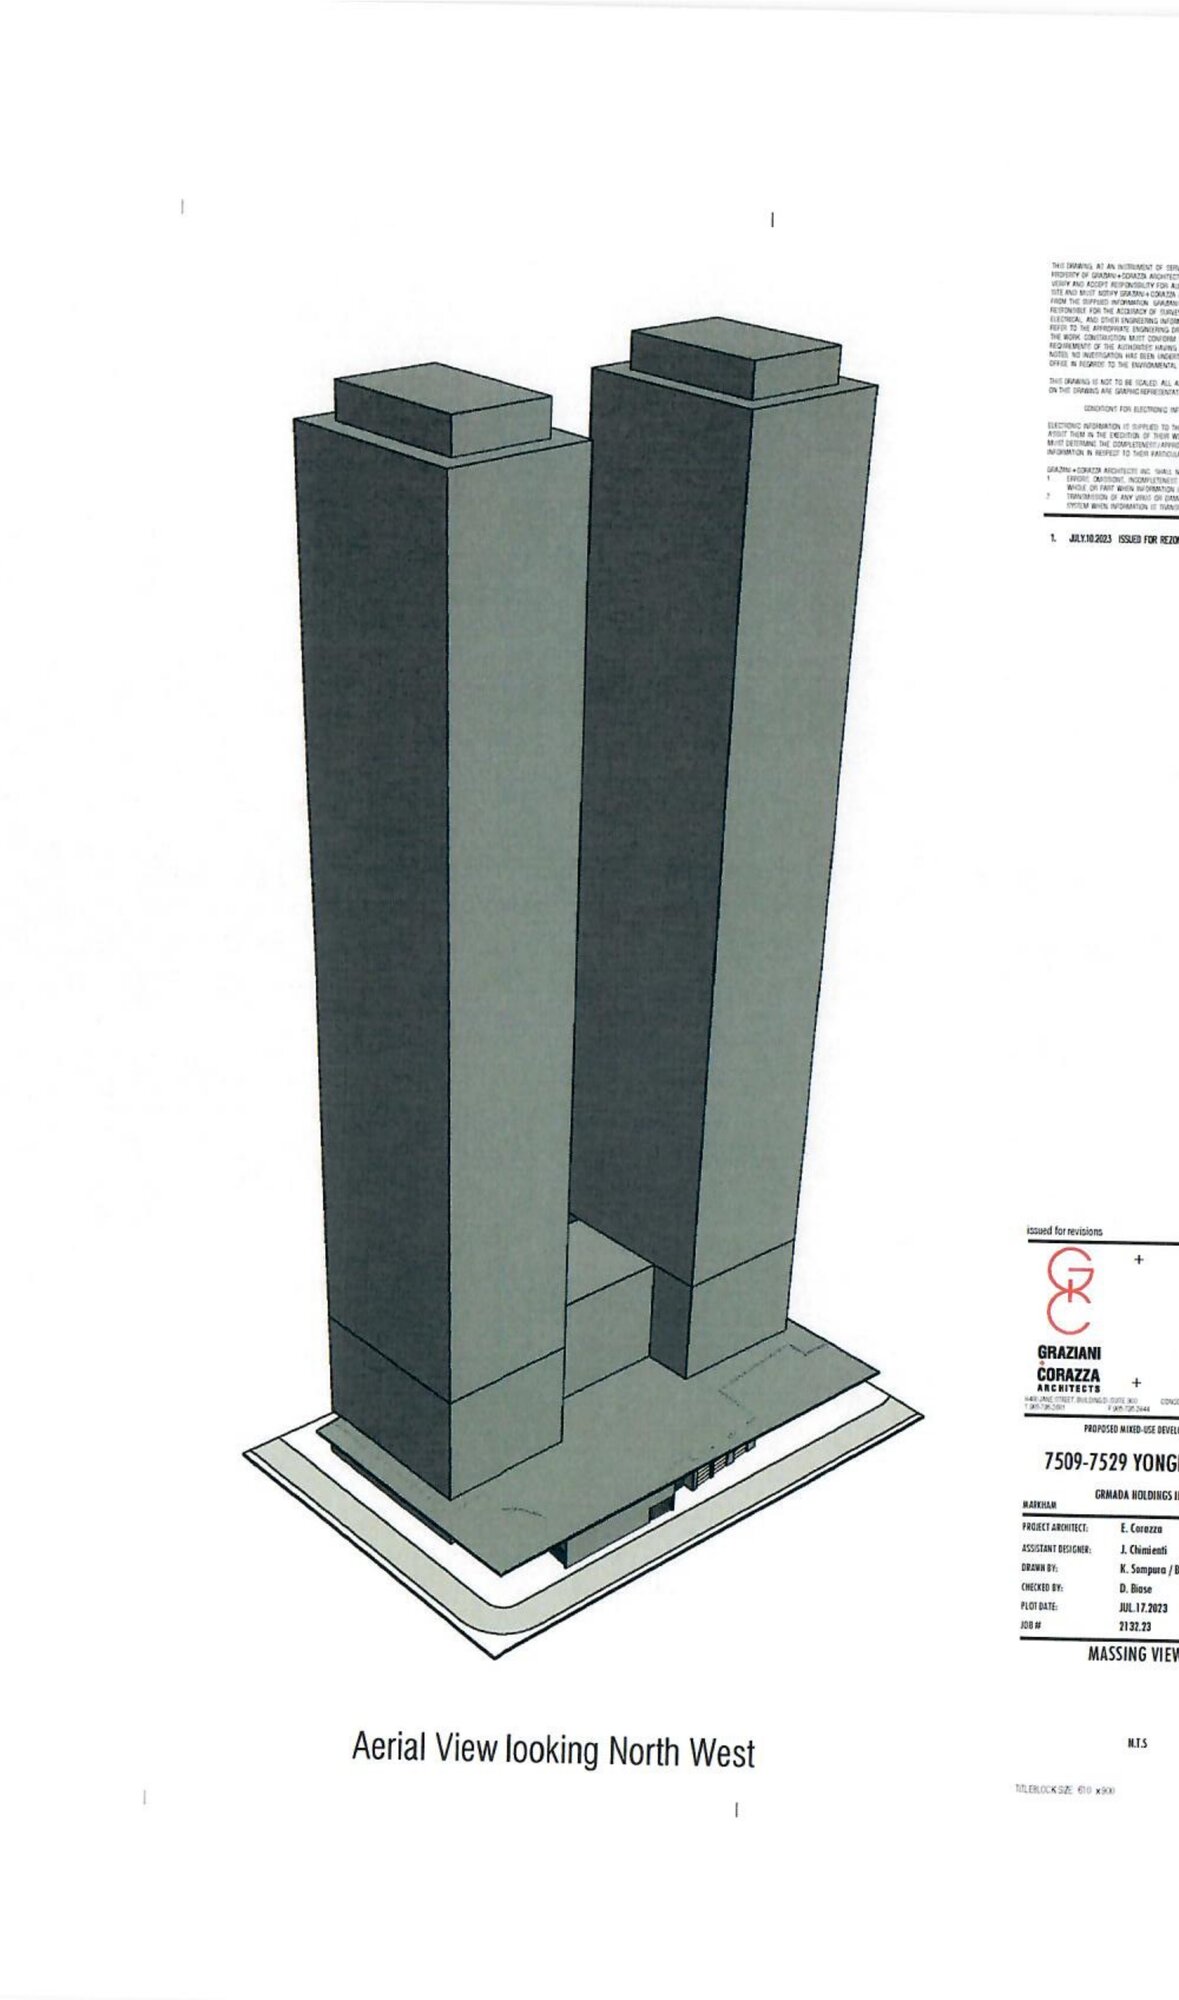
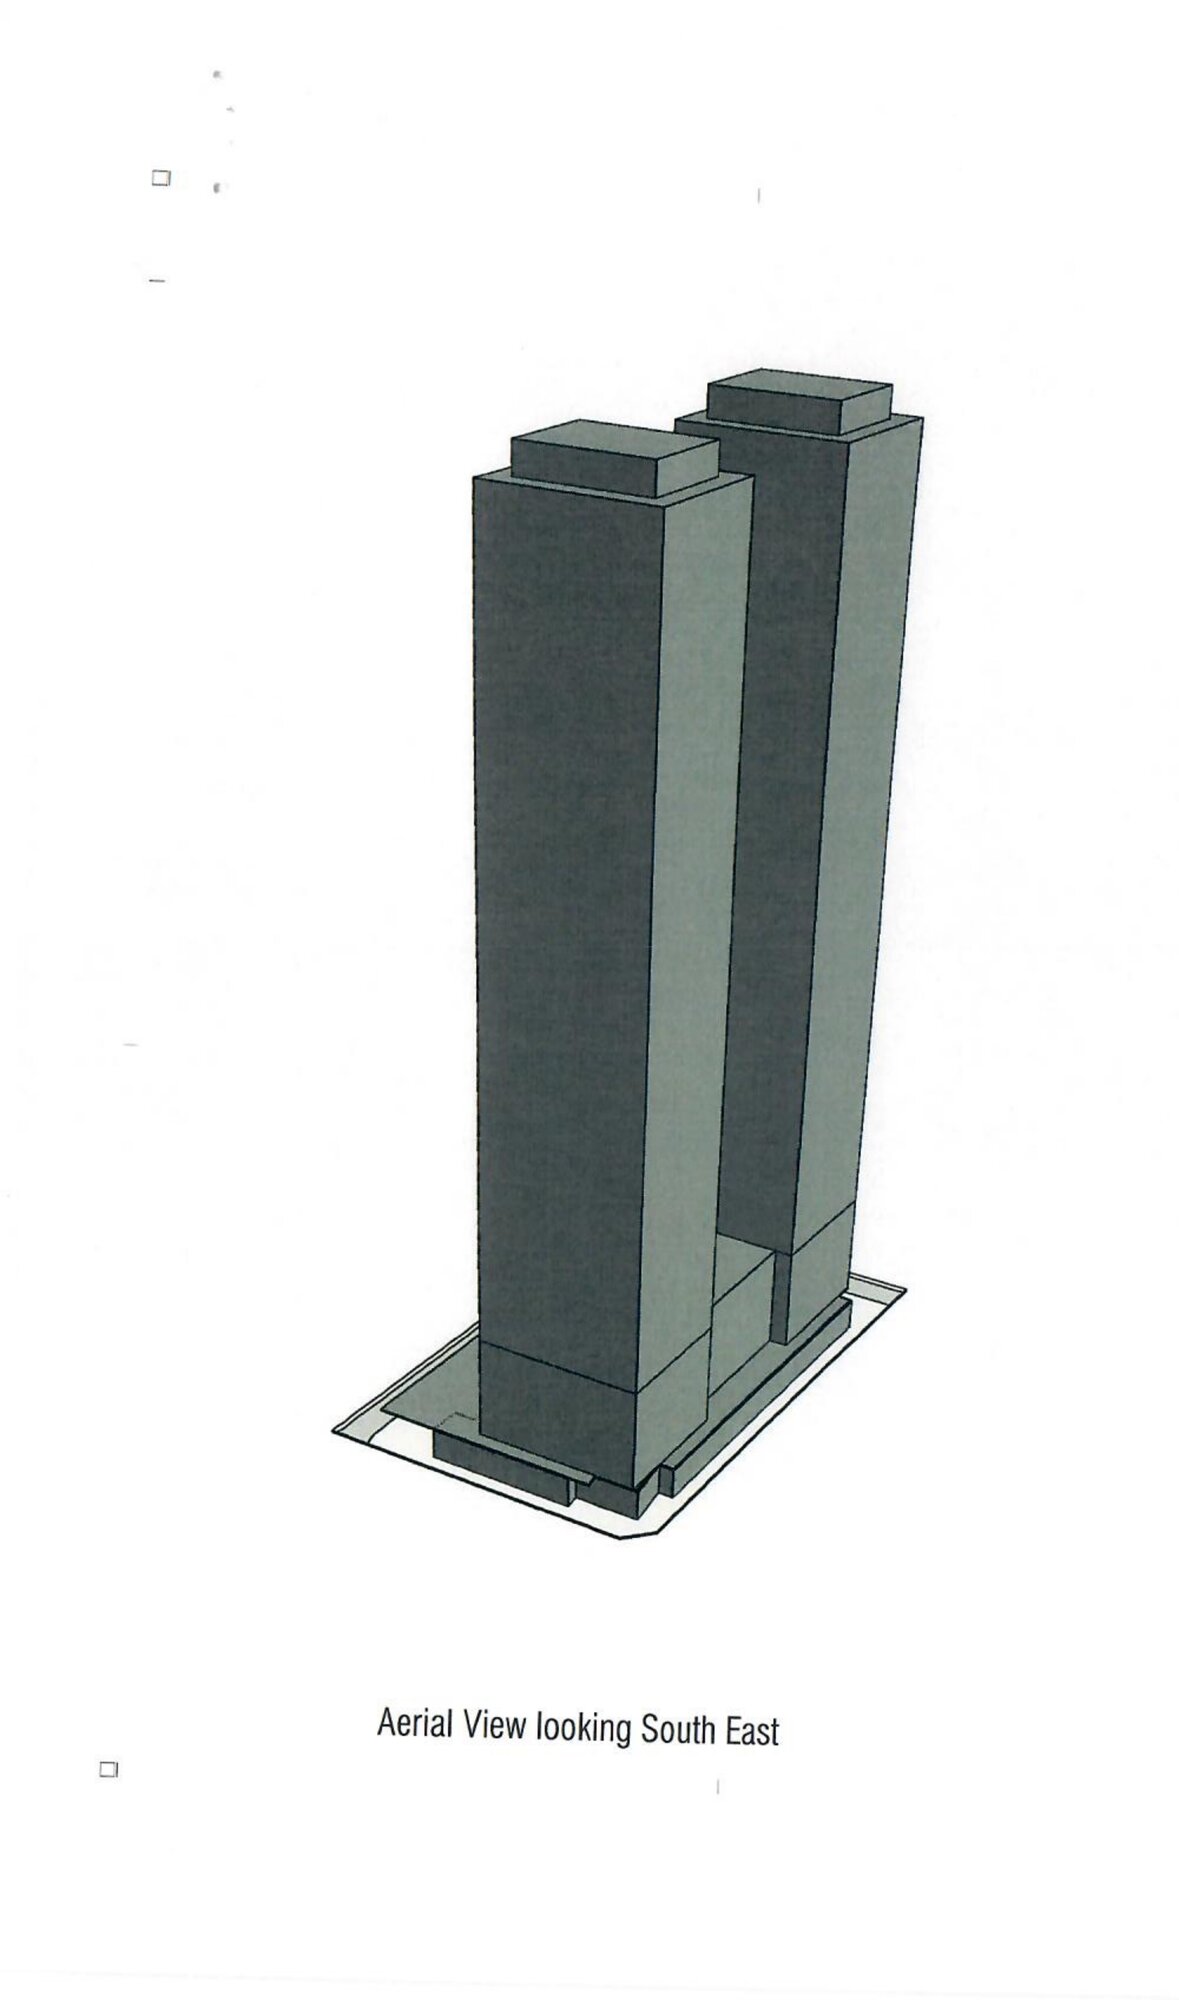
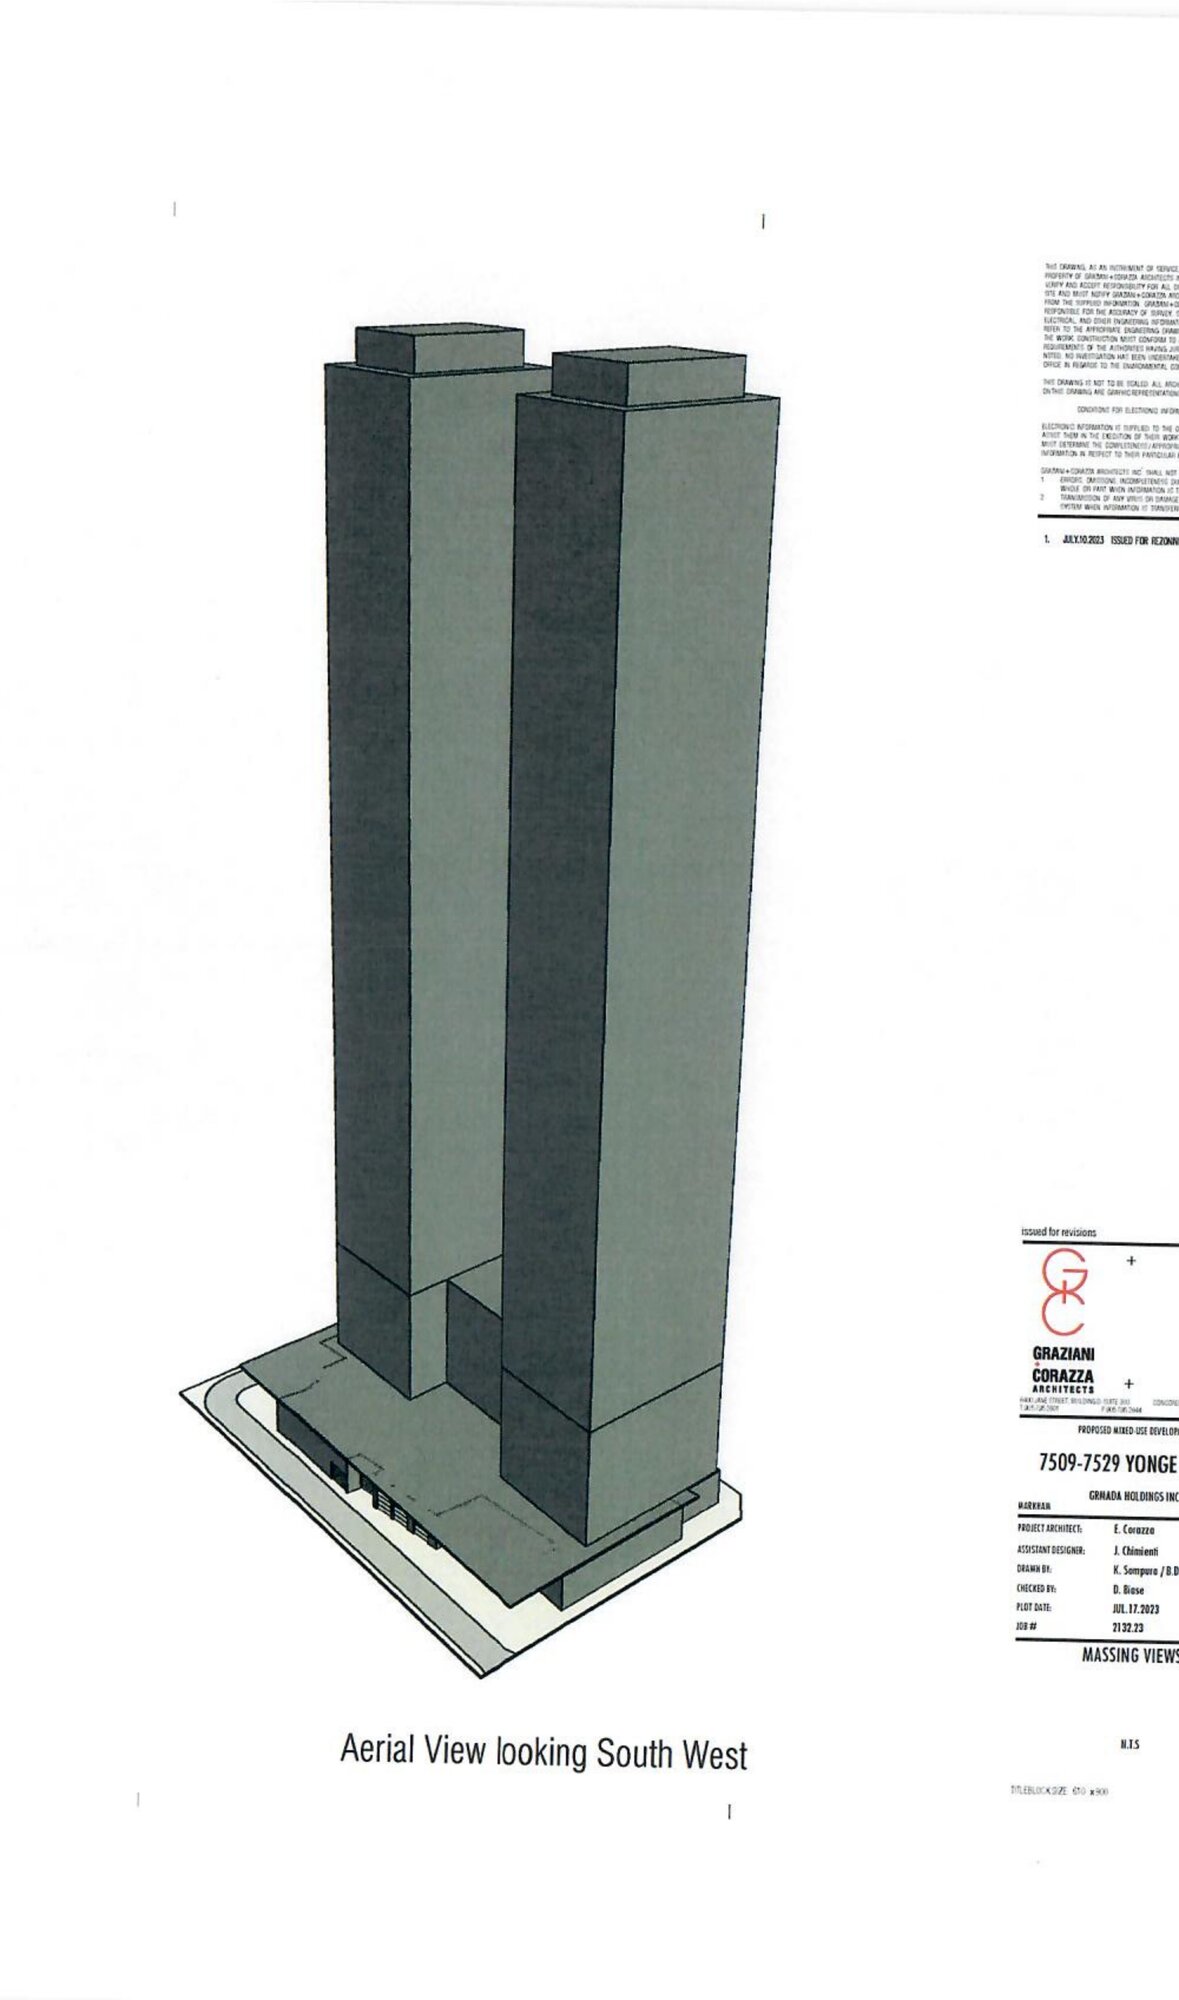
7509–7529 Yonge Street is the development play: a 1.78-acre assembly at the southeast corner of Yonge and Elgin with a Graziani + Corazza-designed proposal for twin 60-storey towers totalling 1,330 residential units above an 8-storey podium with ground-floor retail.
Location
Both sites front Yonge Street in Thornhill, which sits on the border between the City of Markham and the City of Vaughan.
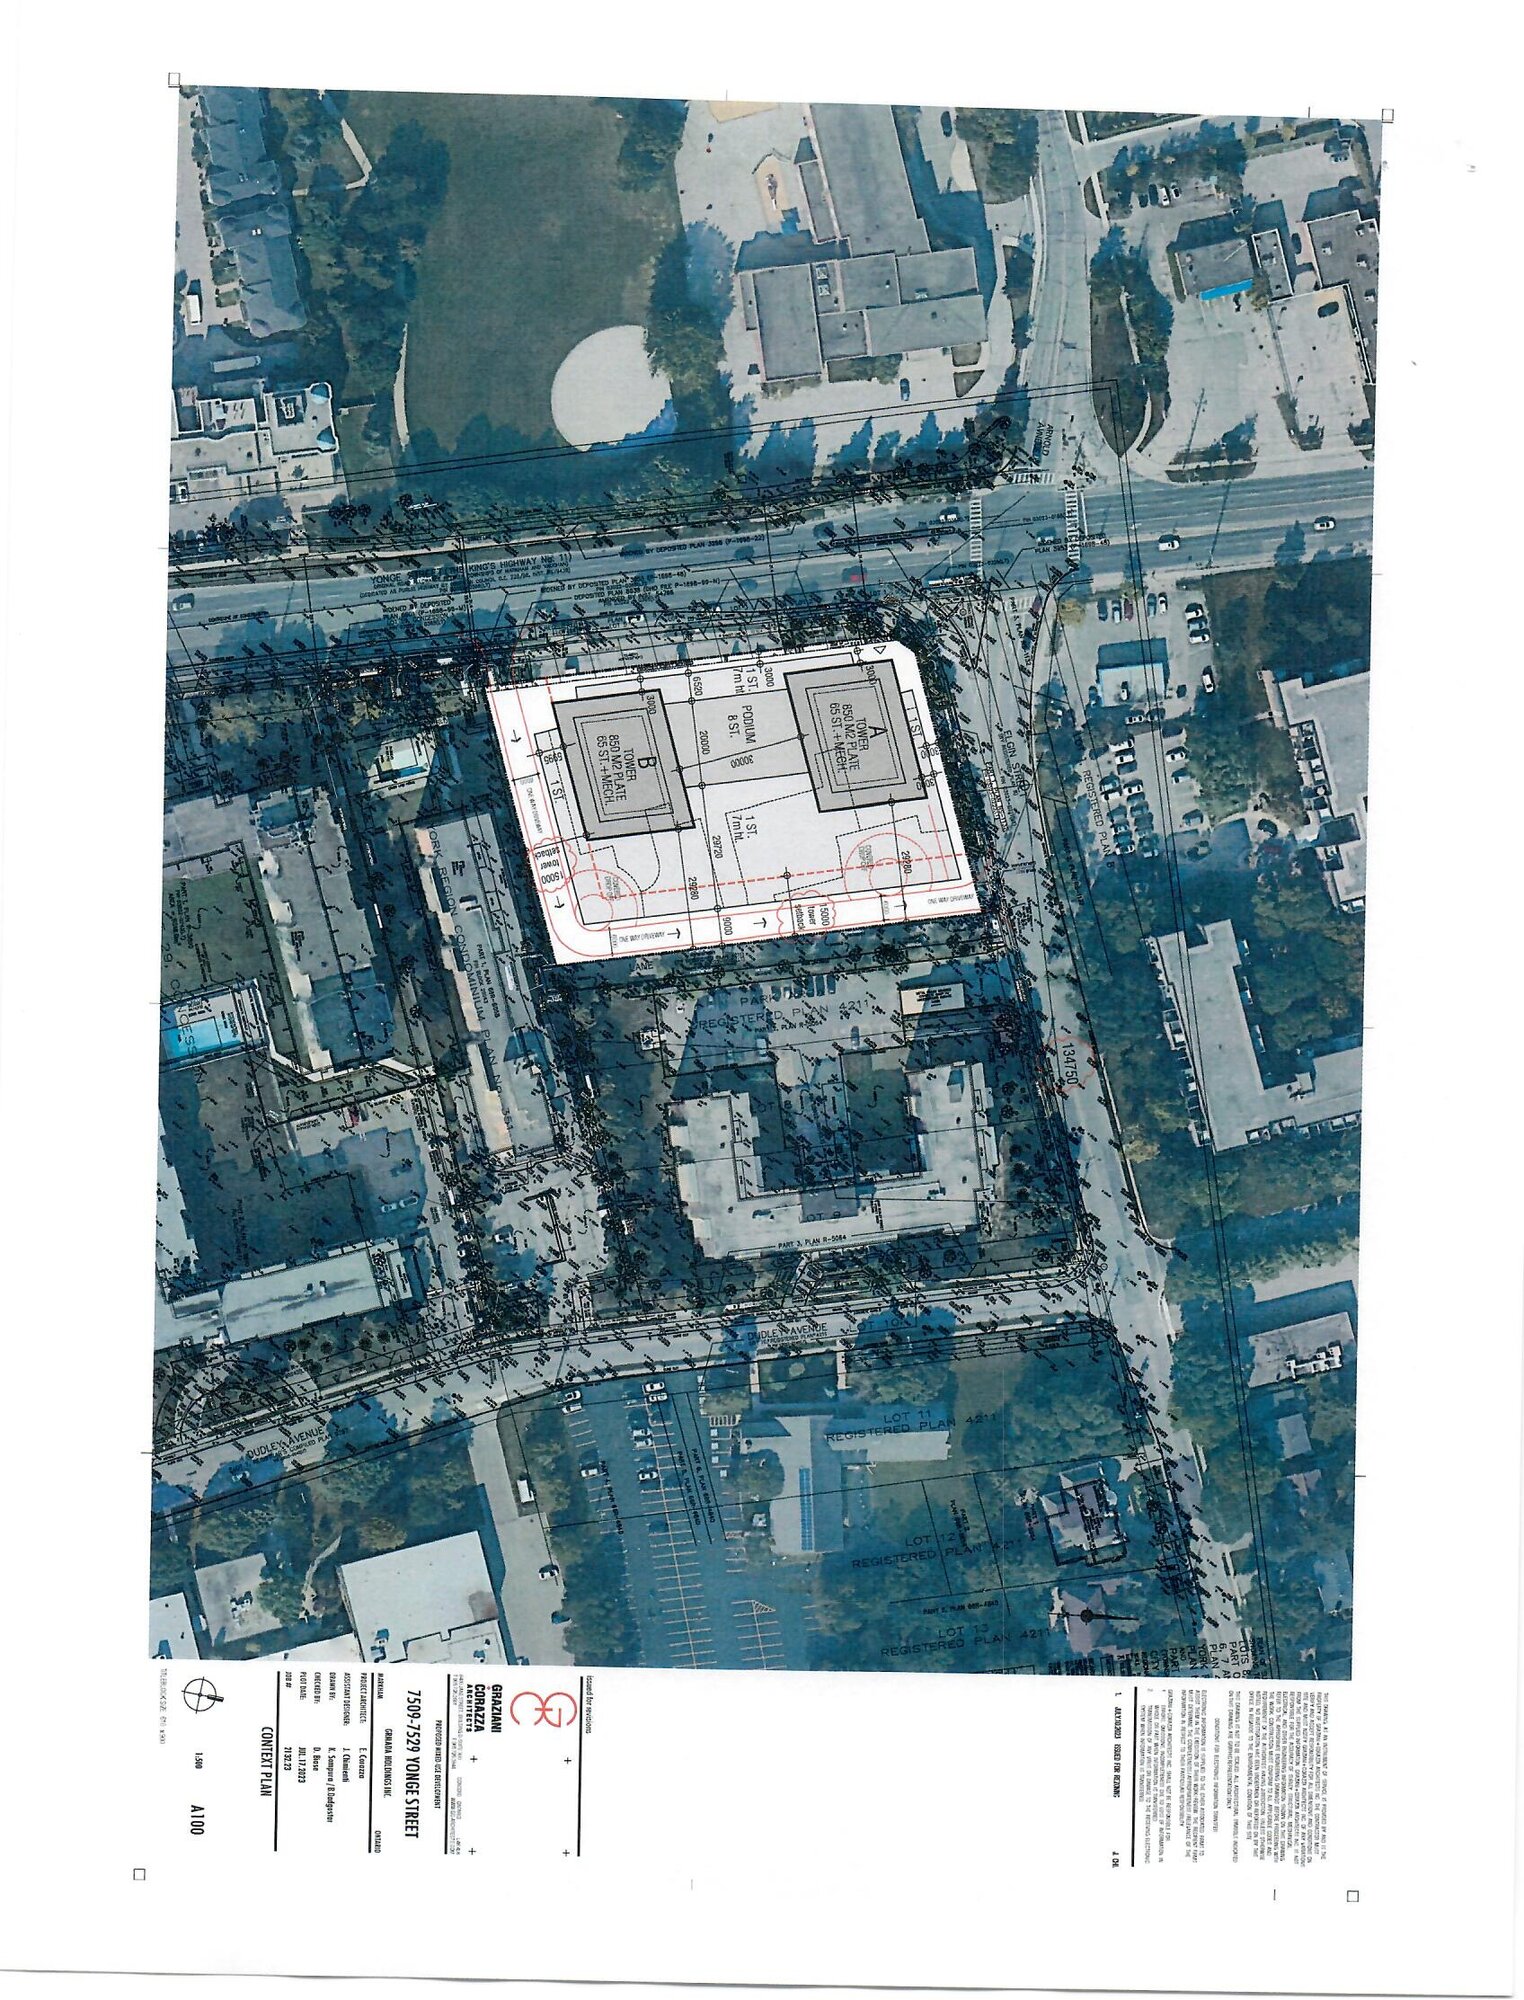
7471 Yonge anchors the intersection of Yonge and Clark. The 7509–7529 assembly occupies the southeast corner of Yonge and Elgin, immediately to the north along the same corridor.
The Site at 7471 Yonge
The Assembly at 7509–7529 Yonge
A development assembly at the southeast corner of Yonge Street and Elgin Street, immediately north of the 7471 acquisition.
The site is currently occupied by two operating businesses on land destined for a long-term redevelopment program designed by Graziani + Corazza Architects.
Transit and Connectivity
The Yonge North Subway Extension is an 8-kilometre extension of TTC Line 1 north from Finch Station, adding five new stations along the Yonge corridor.
Clark Station — a future underground stop at Clark Avenue — sits roughly a five-minute walk from both 7471 and 7509–7529 Yonge.
The tunnelling contract was awarded in August 2025 to the North End Connectors consortium, with tunnelling expected to begin in early 2027.
- Yonge North Subway ExtensionTTC Line 1 · under construction
- Clark StationFuture underground · ~5 min walk
- YRT VIVA BlueBRT on Yonge Street
- Langstaff GO StationNearby
- Highway 7 · Highway 407Regional road access
Proposed Development
The proposed development at 7509–7529 Yonge Street is twin 60-storey towers connected by an 8-storey podium, designed by Graziani + Corazza Architects.
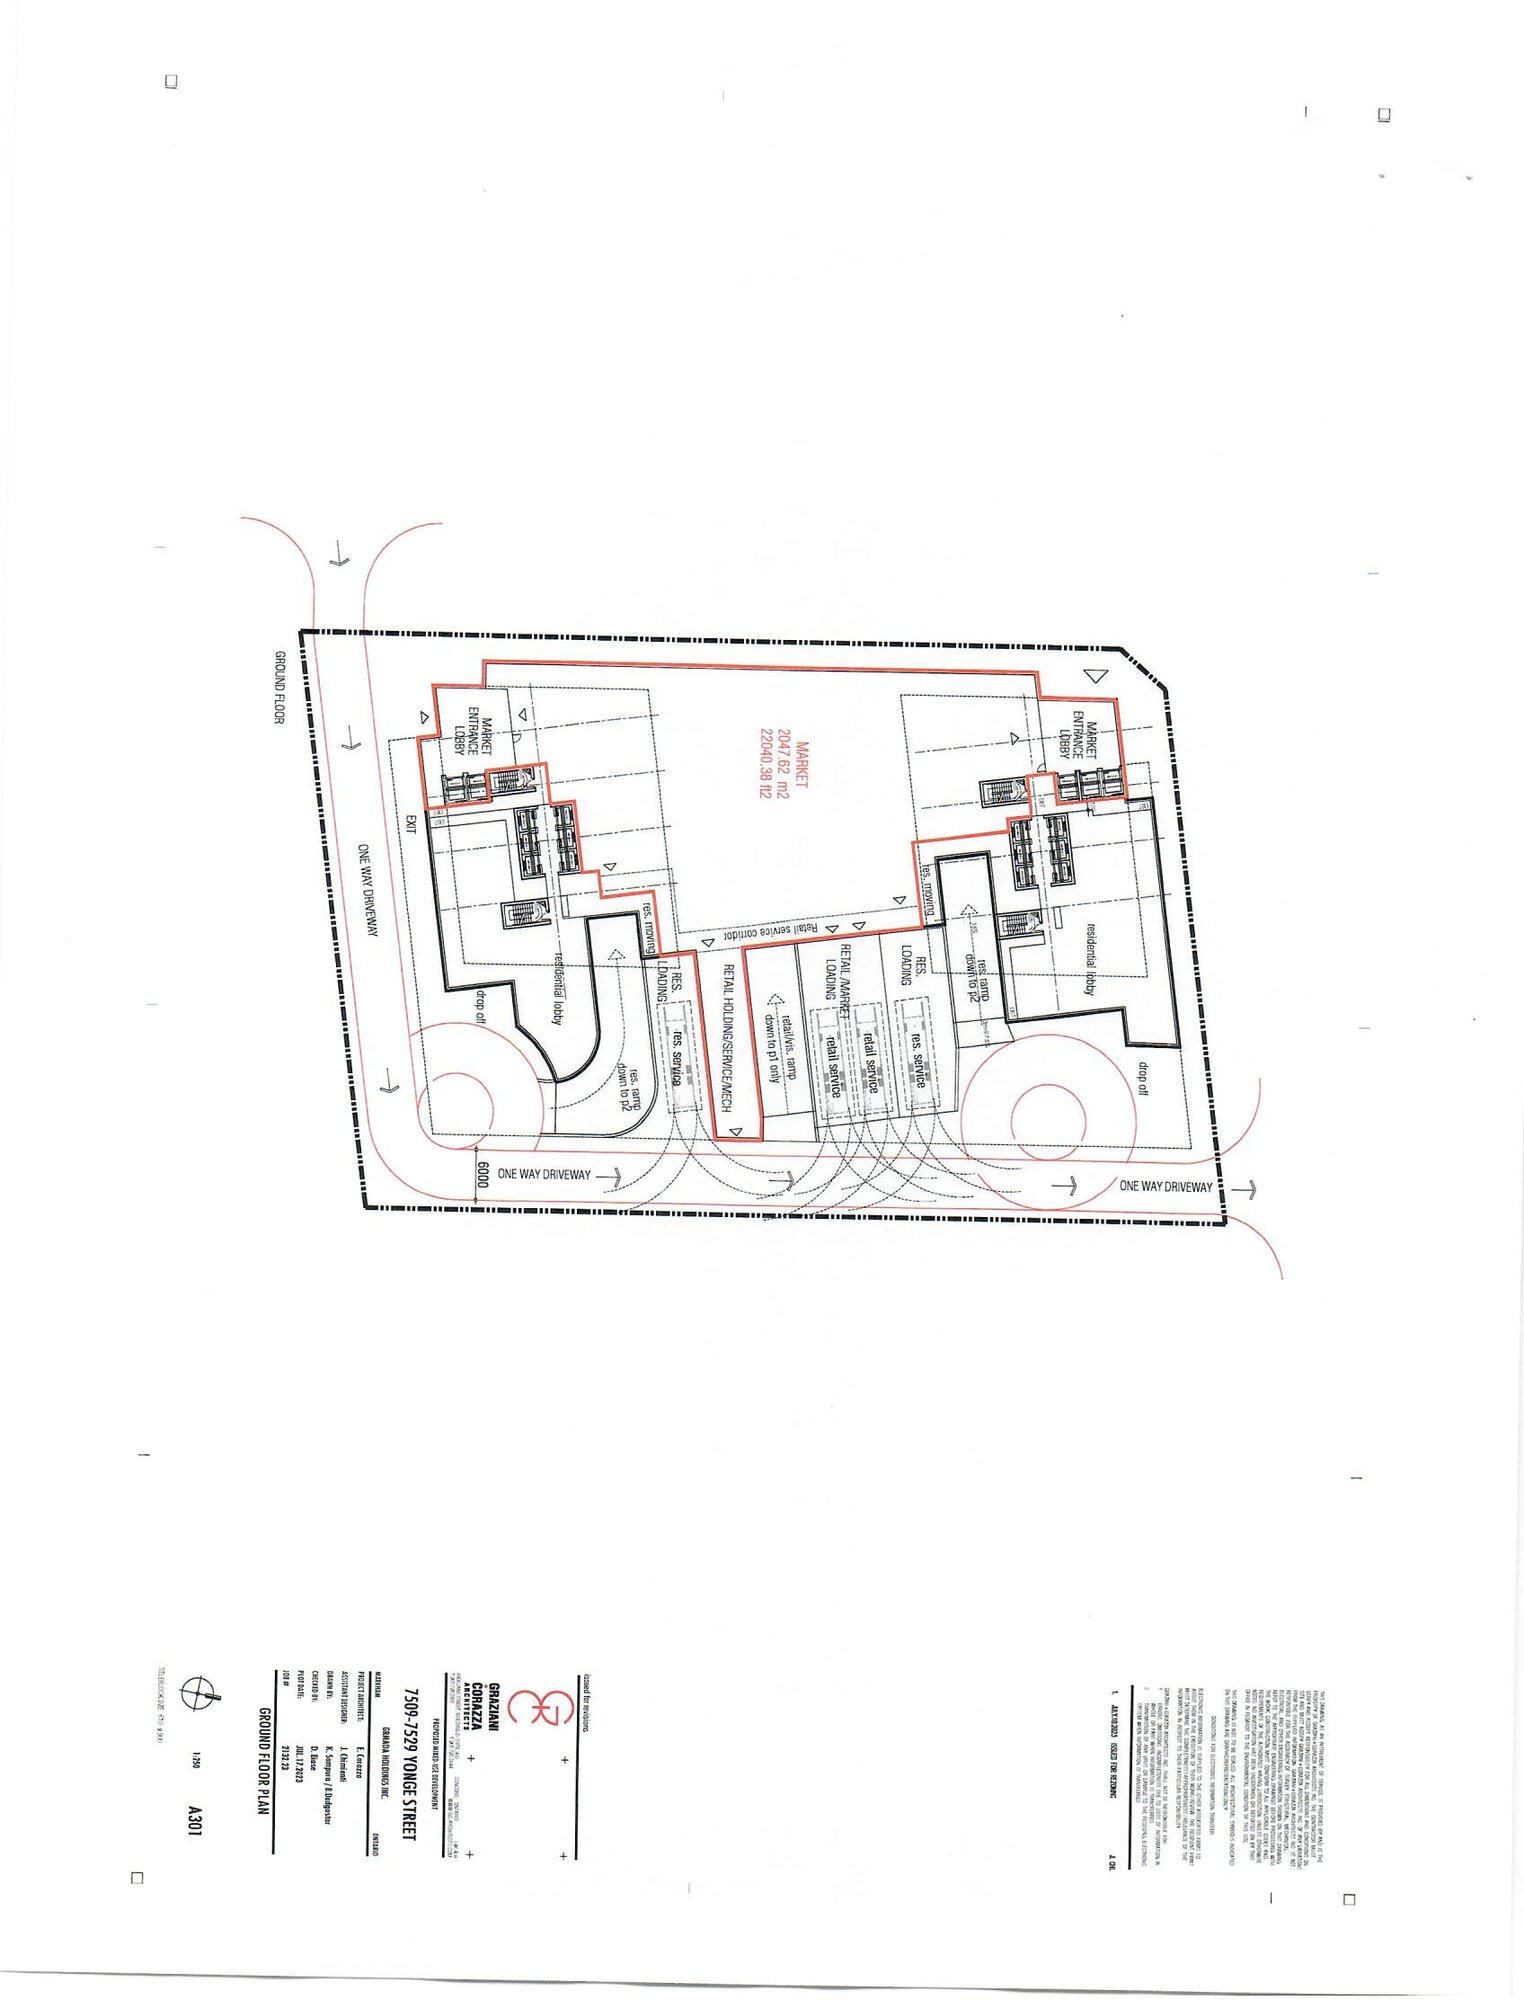
The program totals 1,330 residential units with ground-floor retail along Yonge Street.
Site Plan
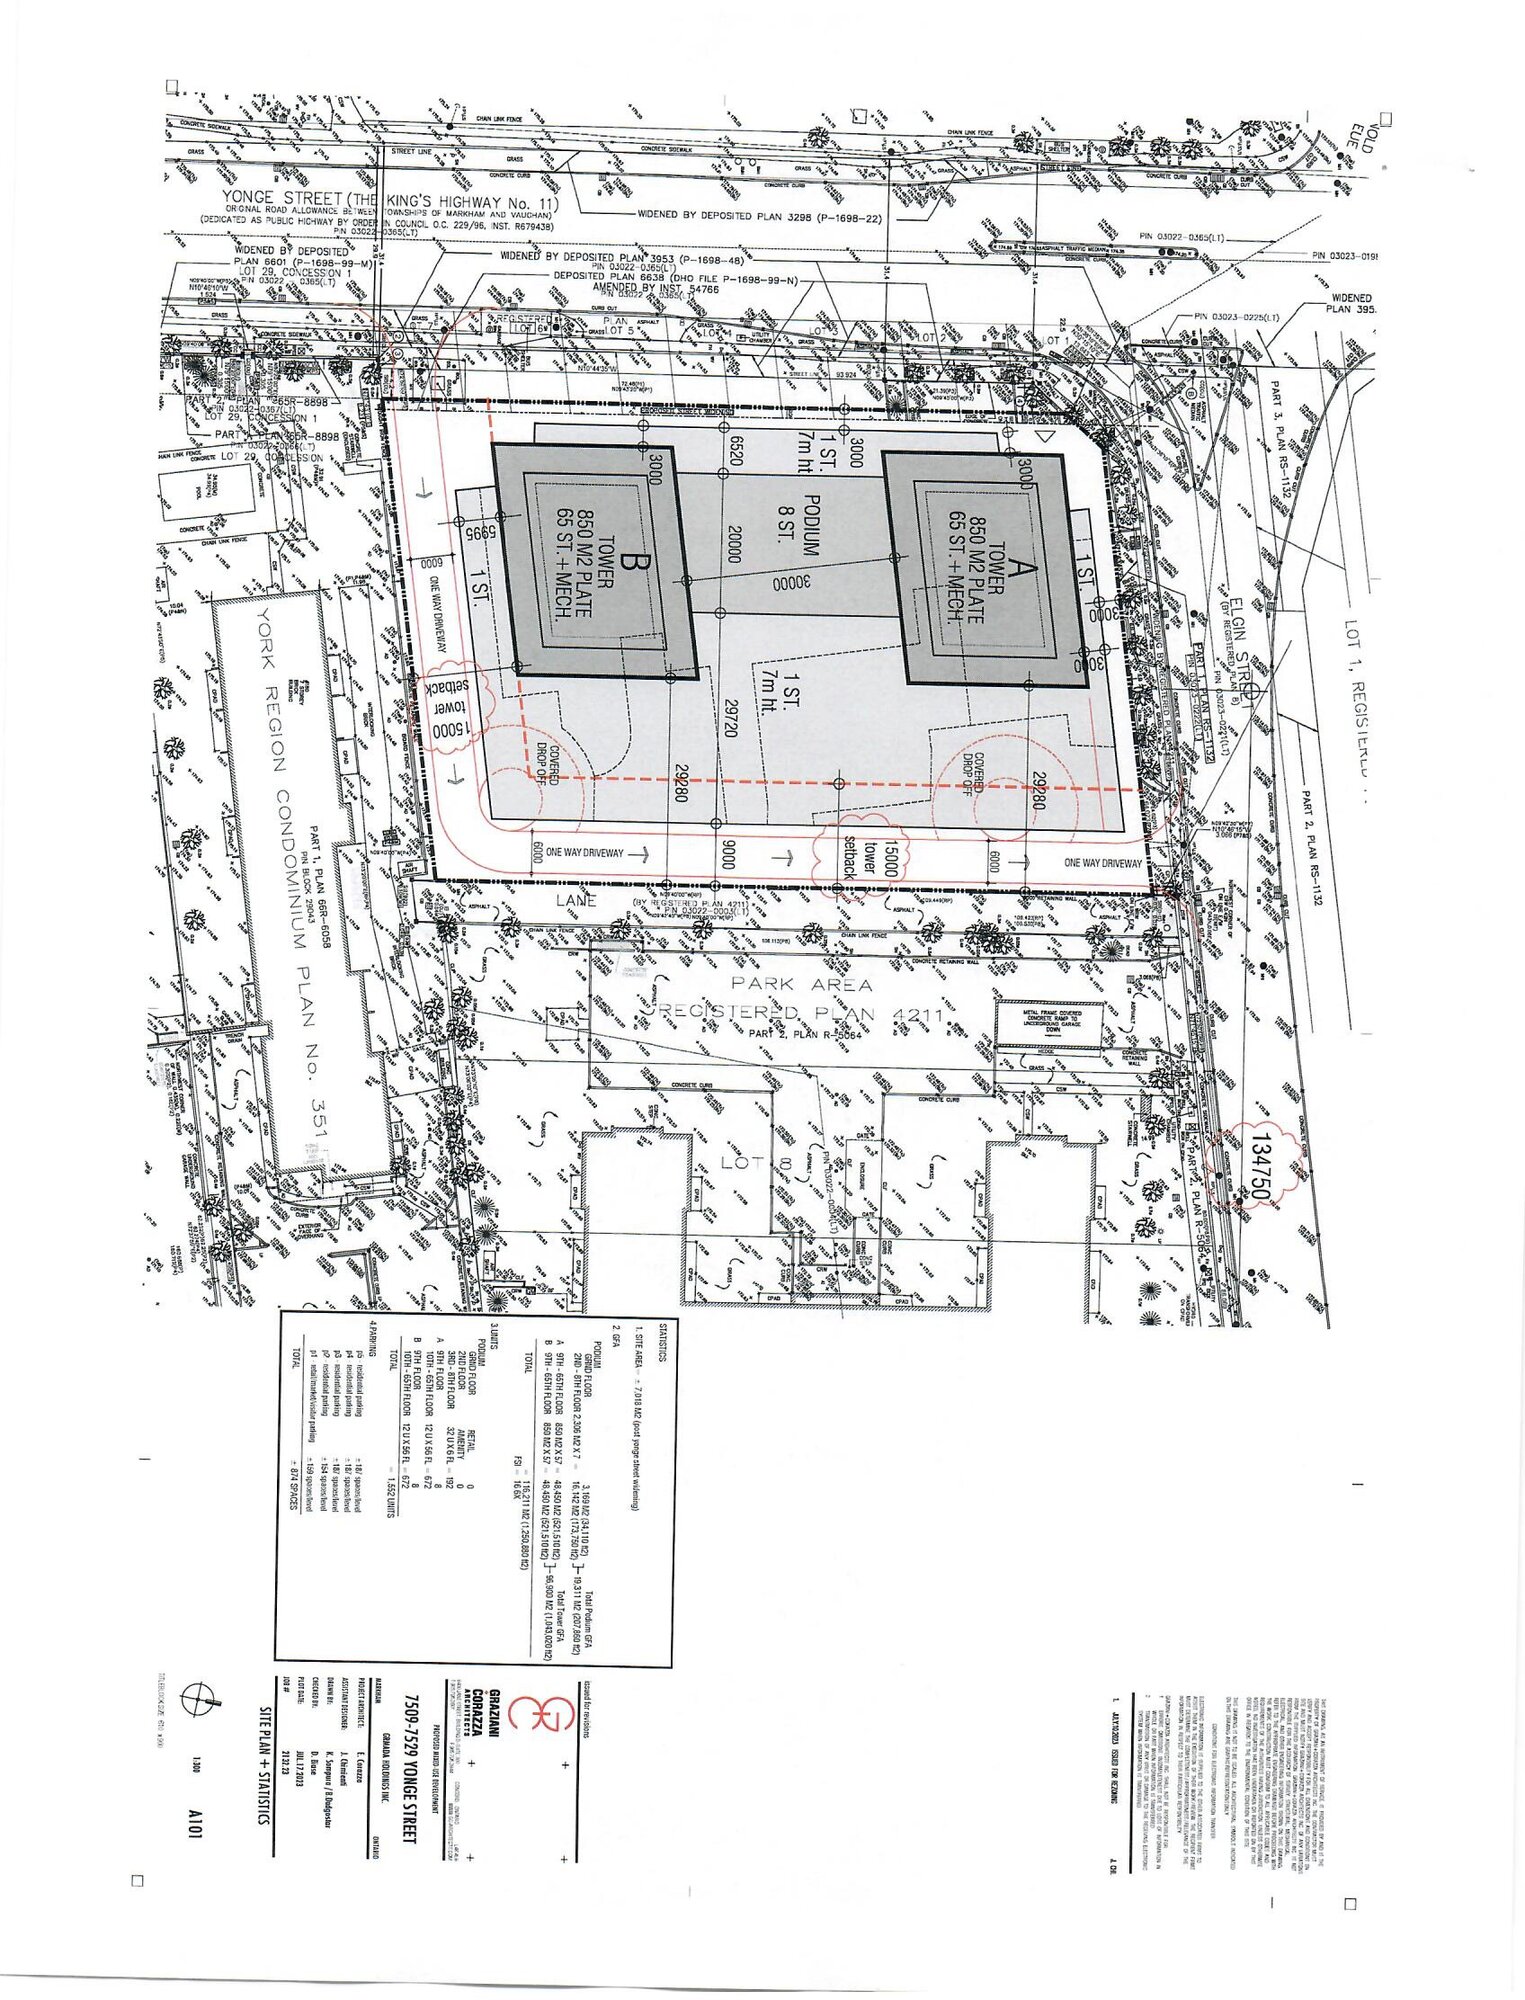
- 7509–7529 YongeAssembly · ~1.78 ac · SE corner Yonge & Elgin
- 7471 YongeLampe Towers · Yonge & Clark
- 170 Dudley AvenueAbutting · 170 Dudley Limited · not in deal
Building Massing
over an 8-storey podium.
Floor Plates
Deal Terms
Approvals and Context
The sites fall within the Yonge Corridor Secondary Plan study area being prepared by the City of Markham.
The City is targeting early 2026 to bring a draft Final Report and draft Secondary Plan to Council. The Secondary Plan, once adopted, will set the long-term policy framework for the Yonge corridor in Markham, including the Thornhill stretch on which both sites front.
- Aug 2025YNSE tunnelling contract awarded to North End Connectors consortium.
- Early 2026Markham targets bringing draft Final Report and draft Secondary Plan to Council (Yonge Corridor Secondary Plan).
- Early 2027YNSE tunnelling expected to begin.
Next Steps
The items below are placeholders. Each will be filled in only with information provided by the sponsor — no figures, dates or counterparties are assumed.